

Its like having a personal stock advisor giving you tips on when to buy or sell!
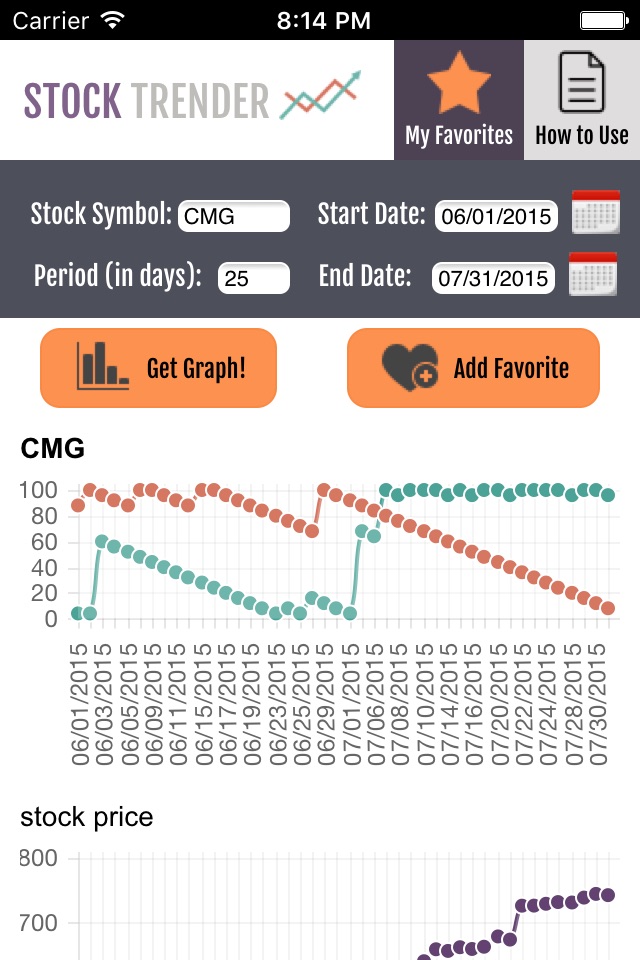
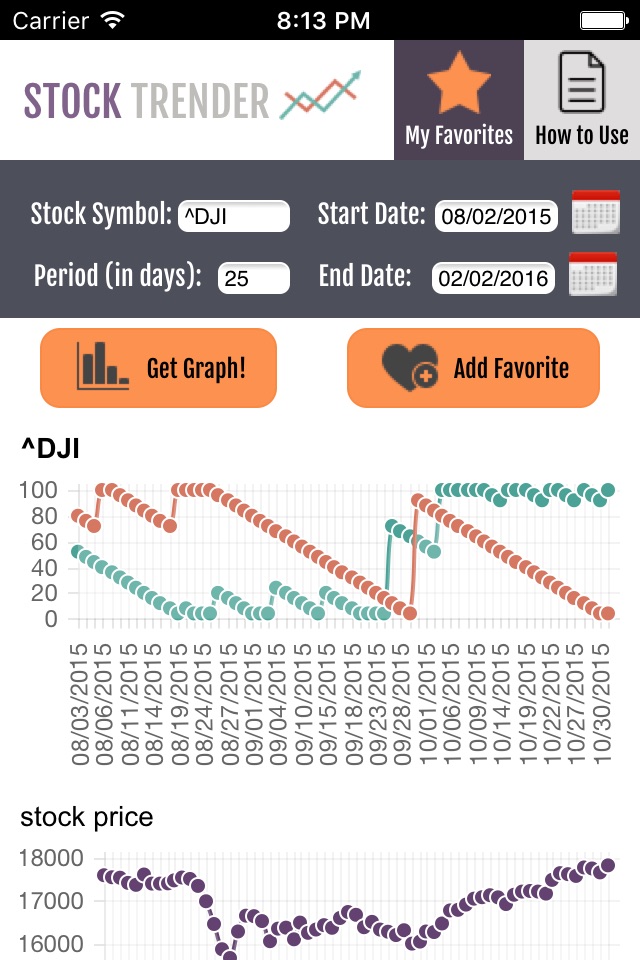
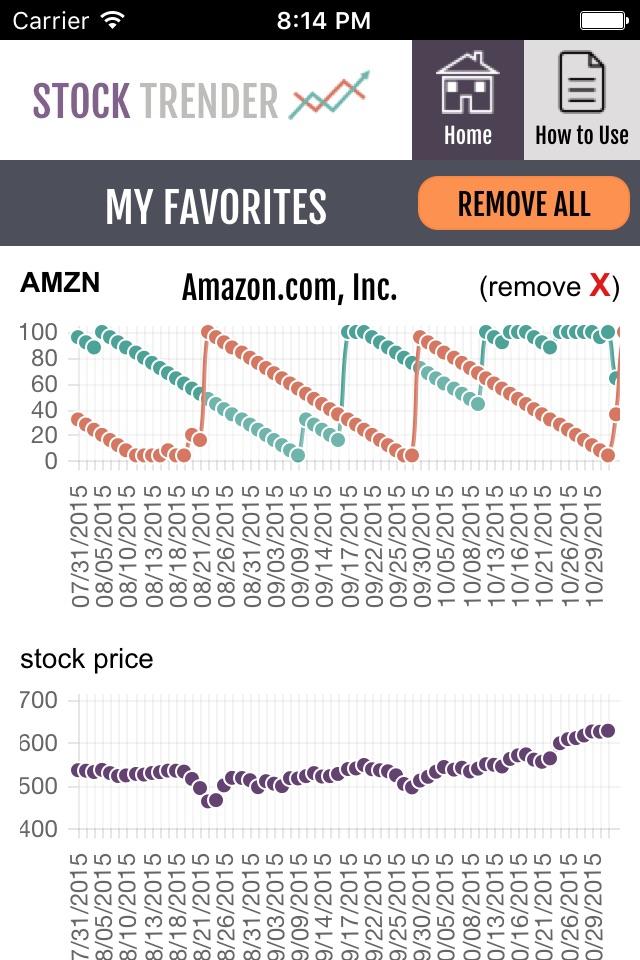
Using easy to read graphs, youll be able to quickly spot stock trends:
It uses a time tested formula to statistically predict the best time to buy or sell a stock, or get in or out of the market in general.
The formula calculates how the stock is trending. The green line displays how likely it is to continue to rise. The red line predicts how likely it is to continue to fall.
The key is to buy when the green line jumps to 100 AND crosses the red line
or sell when the red line jumps to 100 AND crosses the green line.
PLEASE NOTE: Theres no guarantees in the market, its predicting whats most likely to happen.
But its been historically very accurate in making correct predictions.
Use it as a tool to supplement informed decisions on your stock trades!